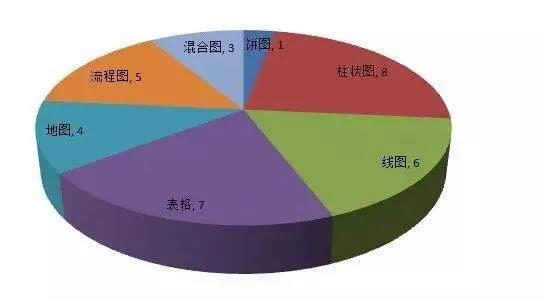
小作文主要是为了考察考生对数据、图表的理解、总结和表达能力。所以,小作文的题型就涵盖了我们经常看到的统计类型,比如流程图、柱状图、表格、饼图、地图、混合图、线图等。

小作文对字数的要求只有150字,而很多考鸭在小作文丢分,原因就是写的太多了!
千万不要带着咱们应试教育的惯性,觉得作文写越多越好,如果小作文部分字数超过太多,其实要警惕,看看是不是你的信息归纳不够准确,导致要用很多重复啰嗦的话去加以解释。
其实,对小作文而言,只要完成这两点,基本就没啥大问题了:
1、能提炼总结数据信息
2、用简洁准确的语言表达出这些信息
举个例子:

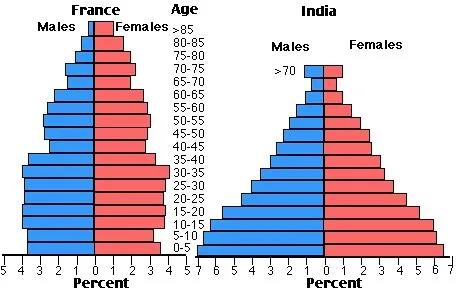
该柱状图对比了1984年的法国和印度两国的人口的年龄结构。
我们找个9分范例分析一下:
The two charts compare the populations of France and India in terms of age distribution by gender in the year 1984.
注:总体概括图标基本信息。
It is clear that the population of India was younger than that of France in 1984, with a noticeably larger proportion of people aged under 20. France, on the other hand, had a significantly larger percentage of elderly inhabitants.
In India, close to 14% of people were aged 5 or under, and each five-year age bracket above this contained an increasingly smaller proportion of the population. France’s population, by contrast, was more evenly distributed across the age ranges, with similar figures (around 7% to 8% of all people) for each five-year cohort between the ages of 0 and 40. Somewhere between 10% and 15% of all French people were aged 70 or older, but the equivalent figure for India was only 2%.
Looking more closely at gender, there was a noticeably higher proportion of French women than men in every cohort from age 50 upwards. For example, almost 3% of French 70- to 75-year-olds were women, while just under 2% were men. No significant gender differences can be seen on the Indian population chart.
如果你想了解更多雅思托福课程,留学规划或者有任何疑问,欢迎联系新航道重庆学校。
新航道重庆学校官网:cq.xhd.cn
新航道重庆学校电话:400-185-9090
推荐阅读:
一起来唠唠出国留学英国后的那些“坑”,用自己的血泪教训给大家排个雷~
关于QS排名前100的澳洲院校的花费大全来啦,想去这些学校的小伙伴们有没有准备好钱包呀?