今天,新航道重庆小编给大家分享的是雅思小作文当中我们遇到的柱状图题目,如何去写作。
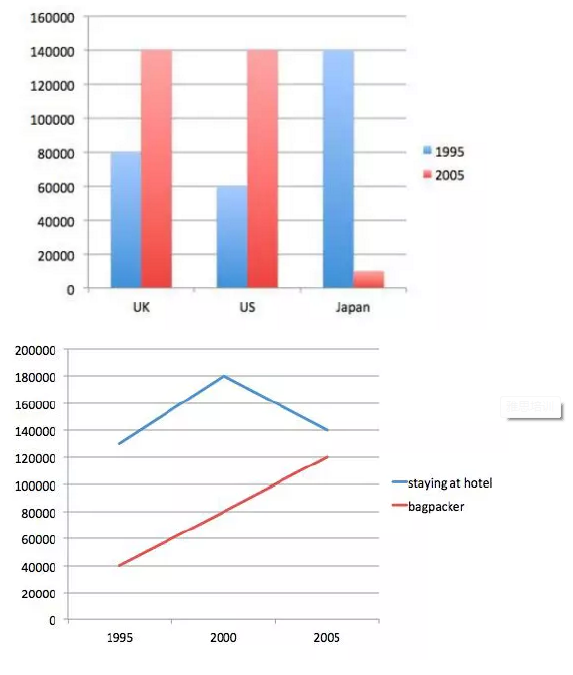
The chart and graph below show the number of tourists from three countries to Australia and two kinds of tourists between 1995 and 2005.
Summarize the information by selecting and reporting the main features and make comparisons where possible.

“组合型”图表
柱图部分:
* 同时不同项(例如:英国、美国、日本同在1995年),需要比较国家之间在同一个时间点上的差异;
* 同项不同时(例如:英国分别在1995年和2005年),需要比较同一个国家在不同时间点上的差异。
线图部分:
* 很简单。
教师示范
The chart and graph show the number of tourists from three countries to Australia and two types of tourists over the period of 1995 to 2005. Overall, the UK and the US contrasted sharply with Japan in both years, and there was a significant change of number among each of the two types of travelers.
如果把对于图表的总述写在开头段落里,那么就可以从开头到主体的行文中自然形成“总—分”结构。分 The year of 1995 saw that half (140,000) of the tourists from the three countries were Japanese, 这句暗示了英美加起来等于日本。and American tourists were roughly as many as their British counterparts. The year of 2005 saw a changed situation: not only did American and British travelers comprise the overwhelming majority, they also had even number. It may have been a coincidence that both numbers were equal to that of 1995’s Japanese tourists. In 2005, the mere 10,000 Japanese tourists represented 不机械描述数据 massive shrinkage of Australia’s tourism in the Japanese market.
小总结:不要贪恋于数据细节,而是宏观描述“国家之间/年份之间的异同”。
From 1995 to 2005, although the number of hotel dwellers witnessed a marked up-and-down change whereas that of backpackers had three-fold soaring growth, hotels had remained a preferable choice compared with backpacking.
小总结:不要贪恋于数据细节,而是着重描述“整个十年间”的宏观状态。
最后还是要不断重复的提醒:
* 句子主语的多样性可能带来句型的多样性;
* 高频的关键词汇在于表达程度的。
以上就是小编今天给大家分享的相关内容,如果大家想要了解更多留学资讯、留学规划、雅思课程、托福课程或者有任何疑问,欢迎联系新航道重庆学校。
新航道重庆学校官网:cq.xhd.cn
新航道重庆学校电话:400-185-9090
阅读推荐: